Blue Brain Project
EPFL’s Blue Brain Project is a Swiss brain research Initiative led by Founder and Director Professor Henry Markram.
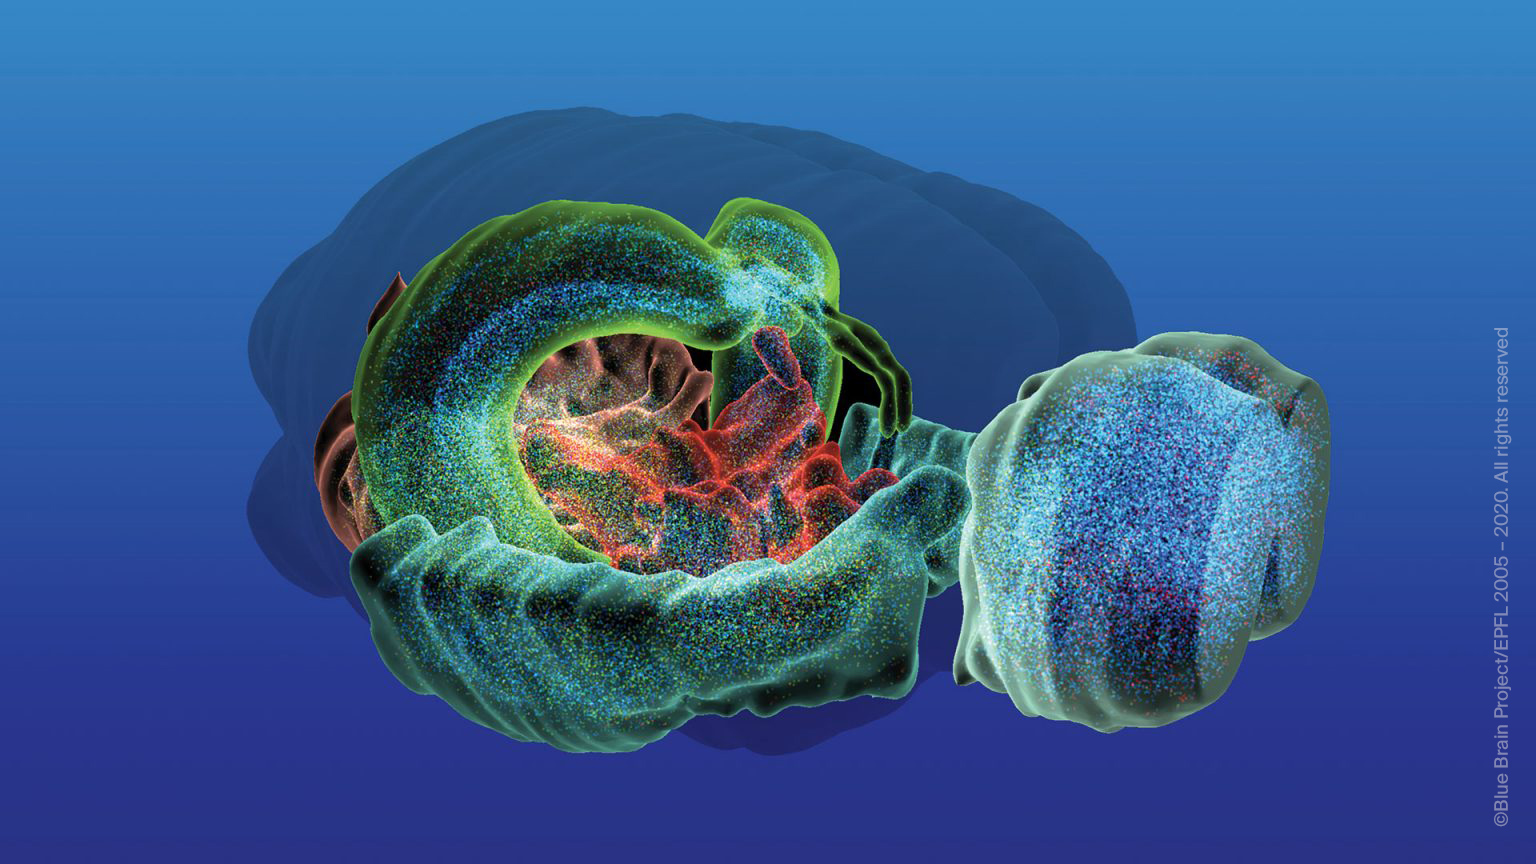
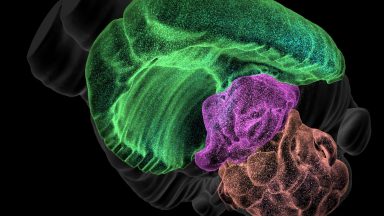
The aim of Blue Brain is to establish simulation neuroscience as a complementary approach alongside experimental, theoretical and clinical neuroscience to understanding the brain, by building the world’s first biologically detailed digital reconstructions and simulations of the mouse brain.
The supercomputer-based simulations and reconstructions built by Blue Brain offer a radically new approach for understanding the multi-level structure and function of the brain.

News
All the news about the Blue Brain Project
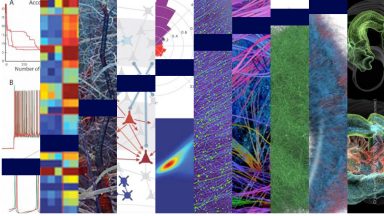
The Real Neuron Challenge

The Real Neuron Challenge
Can you tell the difference between a synthesized or biological neuron?

Events
See when the next Blue Brain Conference or Seminar will be held
Publications
Blue Brain has published 245 papers and pre-prints in scientific journals.
Blue Brain Portal
A knowledge space for simulation neuroscience